
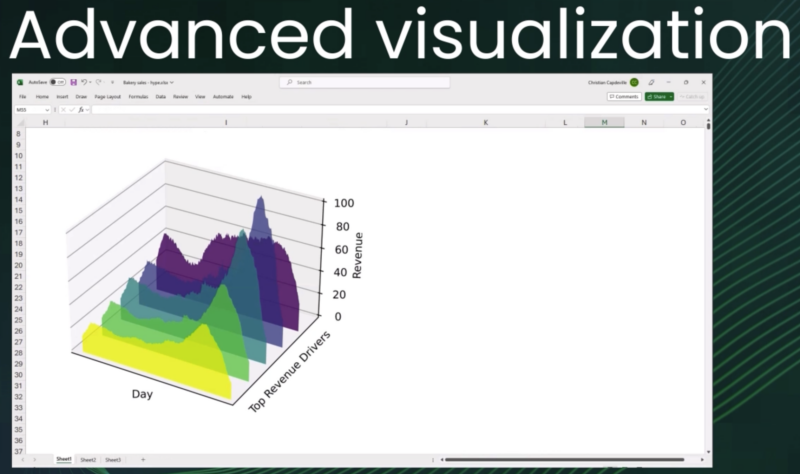
Enlarge / If this kind of thing raises your eyebrows, there’s a whole lot more inside a ribbon bar for you. (credit: Anaconda)
If you’re decent in Python (or aspire to be) but don’t have the chops for advanced data work in Excel, Microsoft now offers the kind of peanut butter-and-chocolate combination that you may consider a gift. At least until it goes behind the paywall.
Microsoft’s Stefan Kinnestrand, writing about “the best of both worlds for data analysis and visualization,” writes that this public preview of Python in Excel will allow spreadsheet tinkerers to “manipulate and explore data in Excel using Python plots and libraries and then use Excel’s formulas, charts, and PivotTables to further refine your insights.”
Microsoft partnered with Python analytics repository Anaconda to bring libraries like Pandas, Statsmodels, and Matplotlib into Excel. Python in Excel runs on Microsoft’s cloud servers, and the company is touting the security that should offer. Python runs in isolated containers, with no access to devices, your network, or user tokens, Microsoft states. Python and Excel can only really talk to each other through limited functions—xl() and =PY()—that can only return code results, not macros, VBA code, or other data, Microsoft claims.